> For the complete documentation index, see [llms.txt](https://docs.ezalgo.ai/llms.txt). Markdown versions of documentation pages are available by appending `.md` to page URLs; this page is available as [Markdown](https://docs.ezalgo.ai/education/technical-analysis/chart-patterns/reversal-patterns/triple-bottom-top.md).
# Triple Bottom / Top
## Triple Bottom
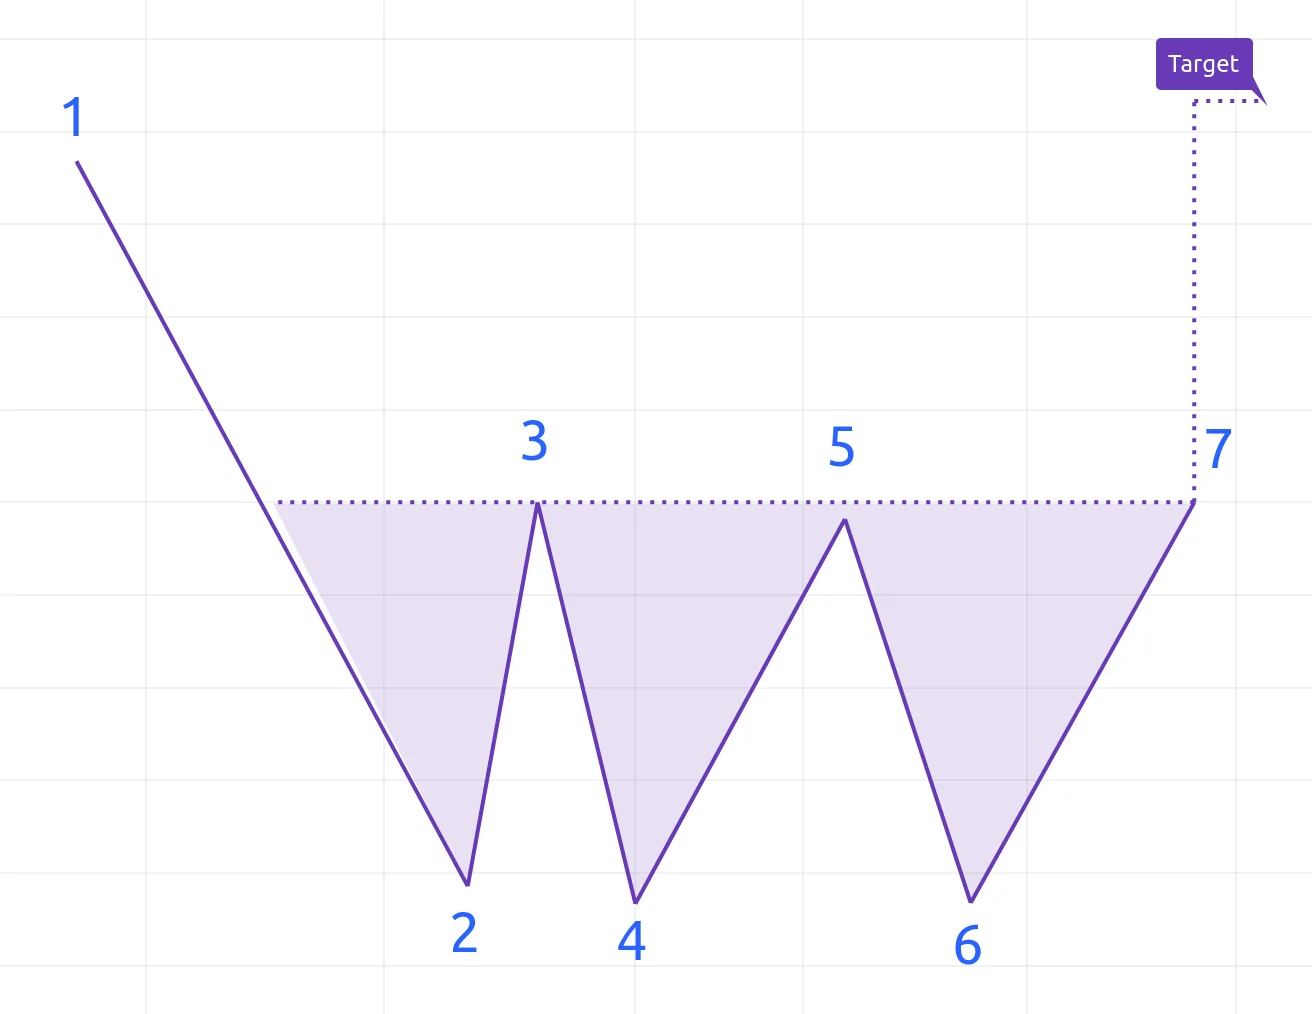
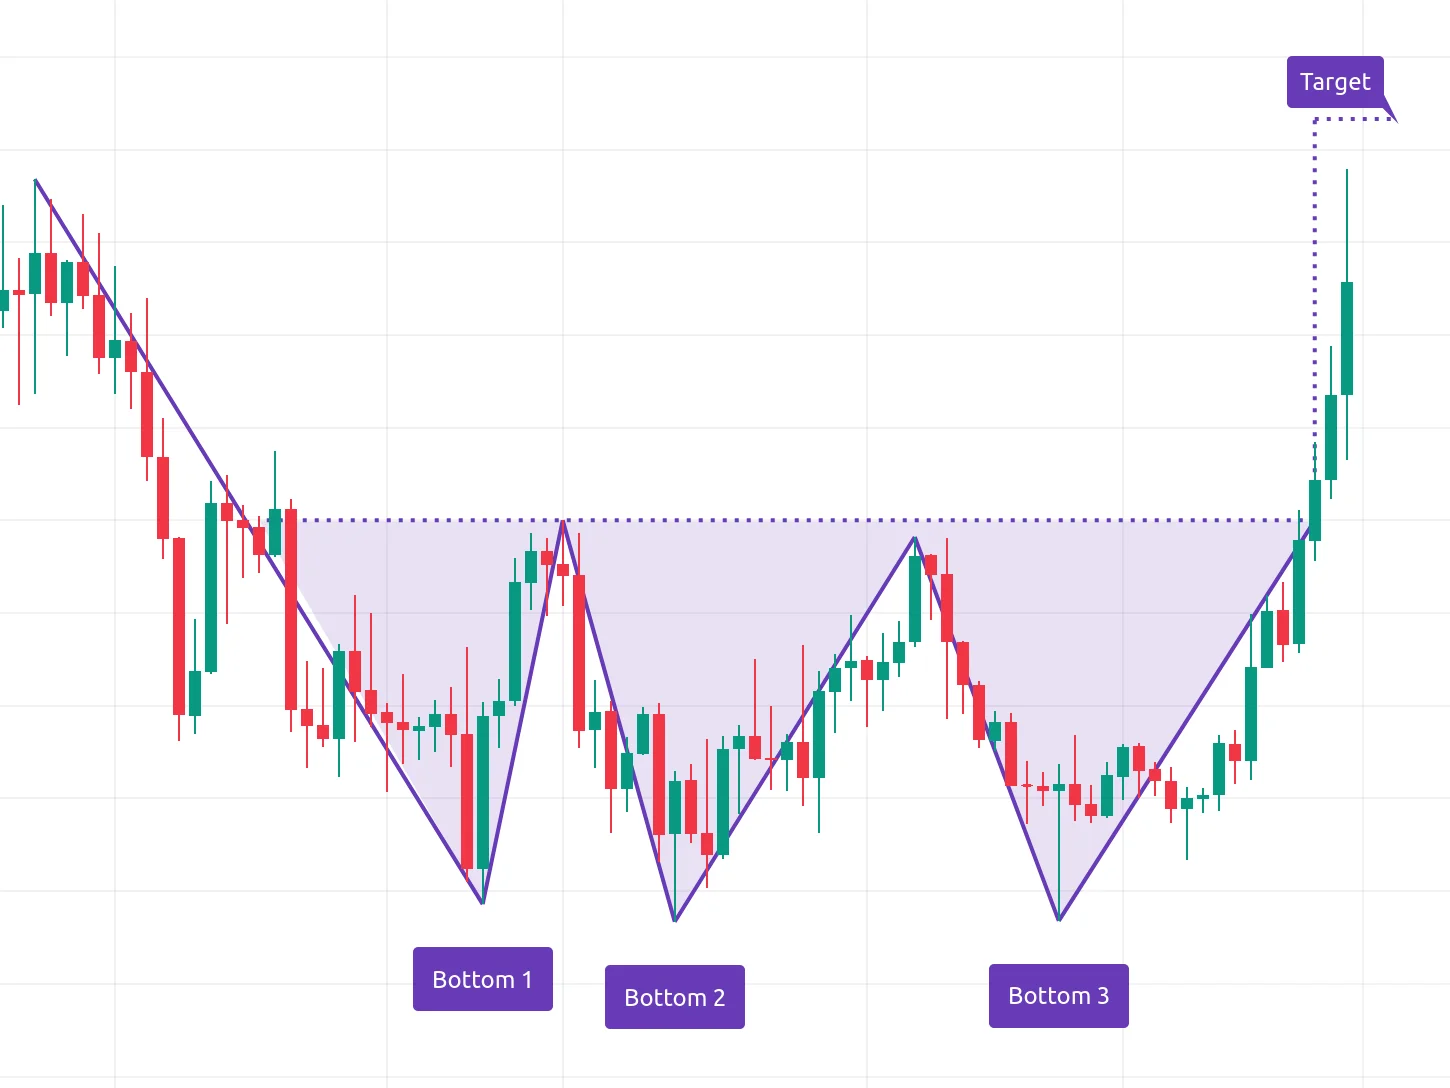
A Triple Bottom is the bullish counterpart of the Triple Top and is considered a bullish reversal chart pattern. This pattern is formed in a downtrend and is characterized by three distinct valleys at approximately the same price level. The three lows are separated by two peaks, with the middle peak being higher than the other two. The pattern is confirmed when the price breaks above the resistance level (formed by the peaks), indicating that the price may start to move upward.
## Triple Top
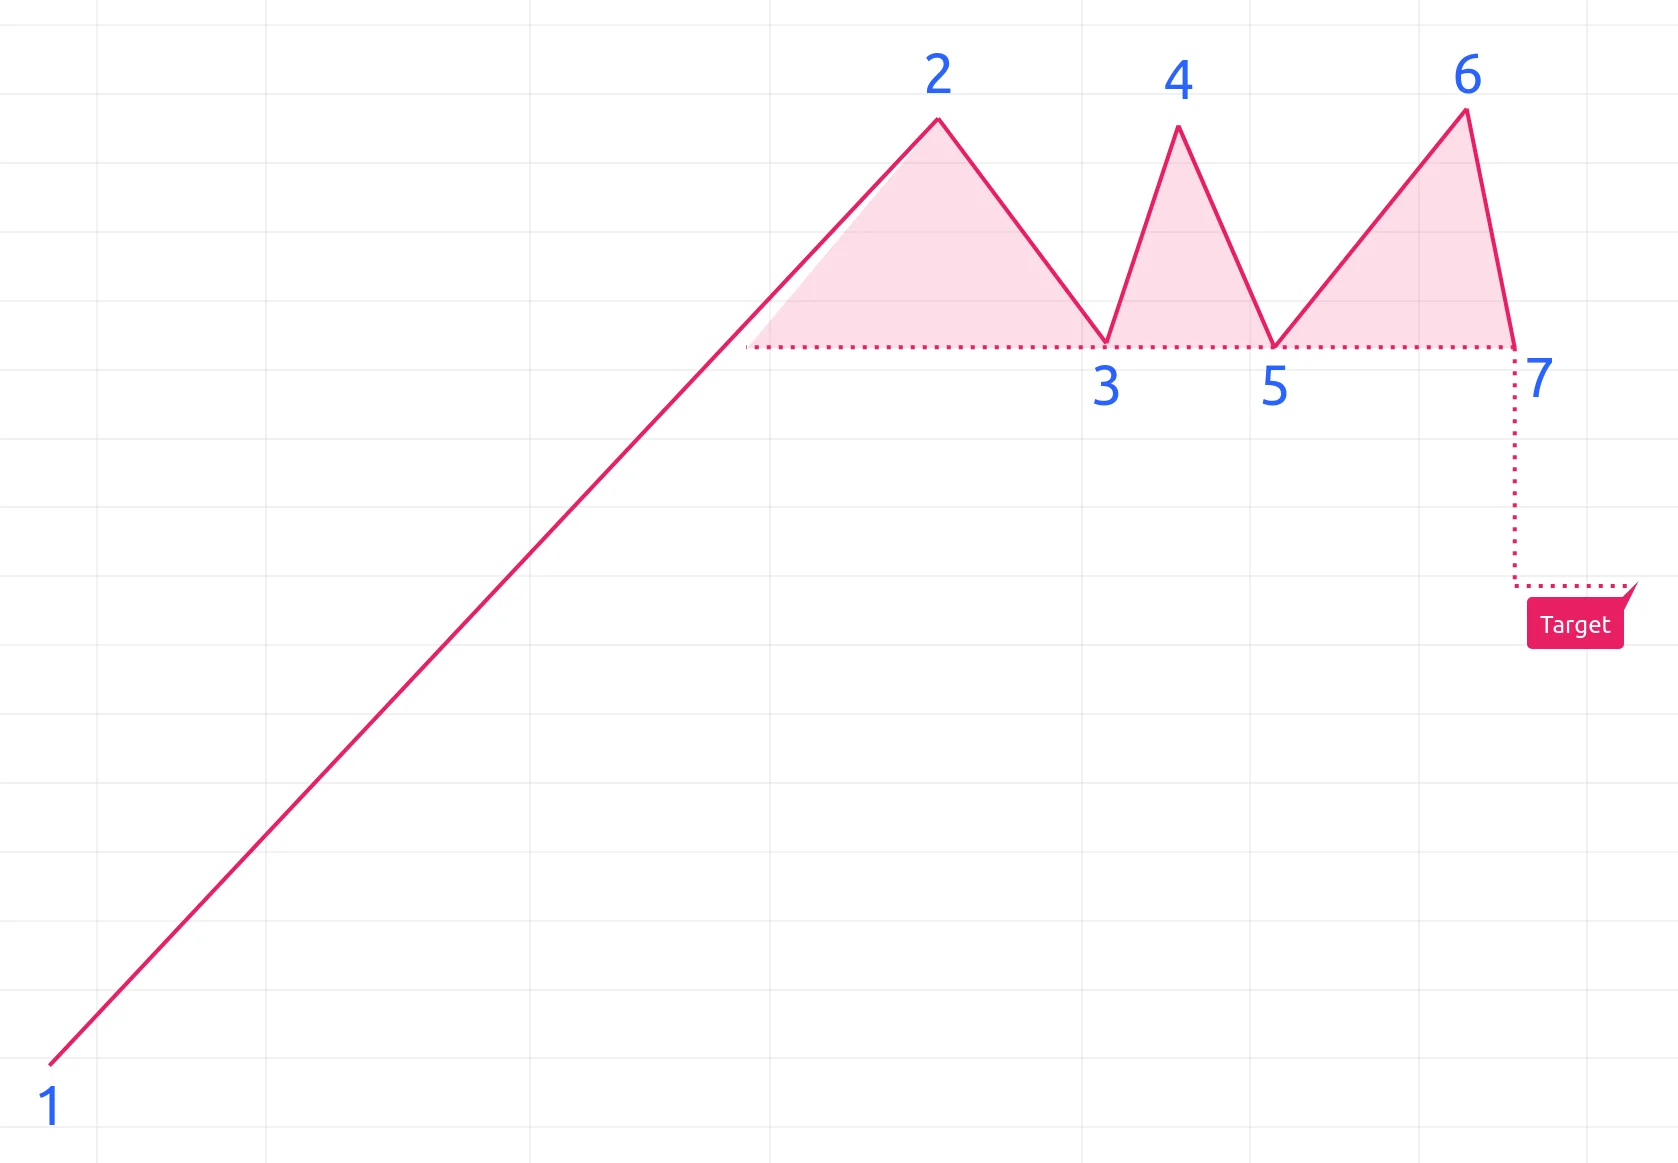
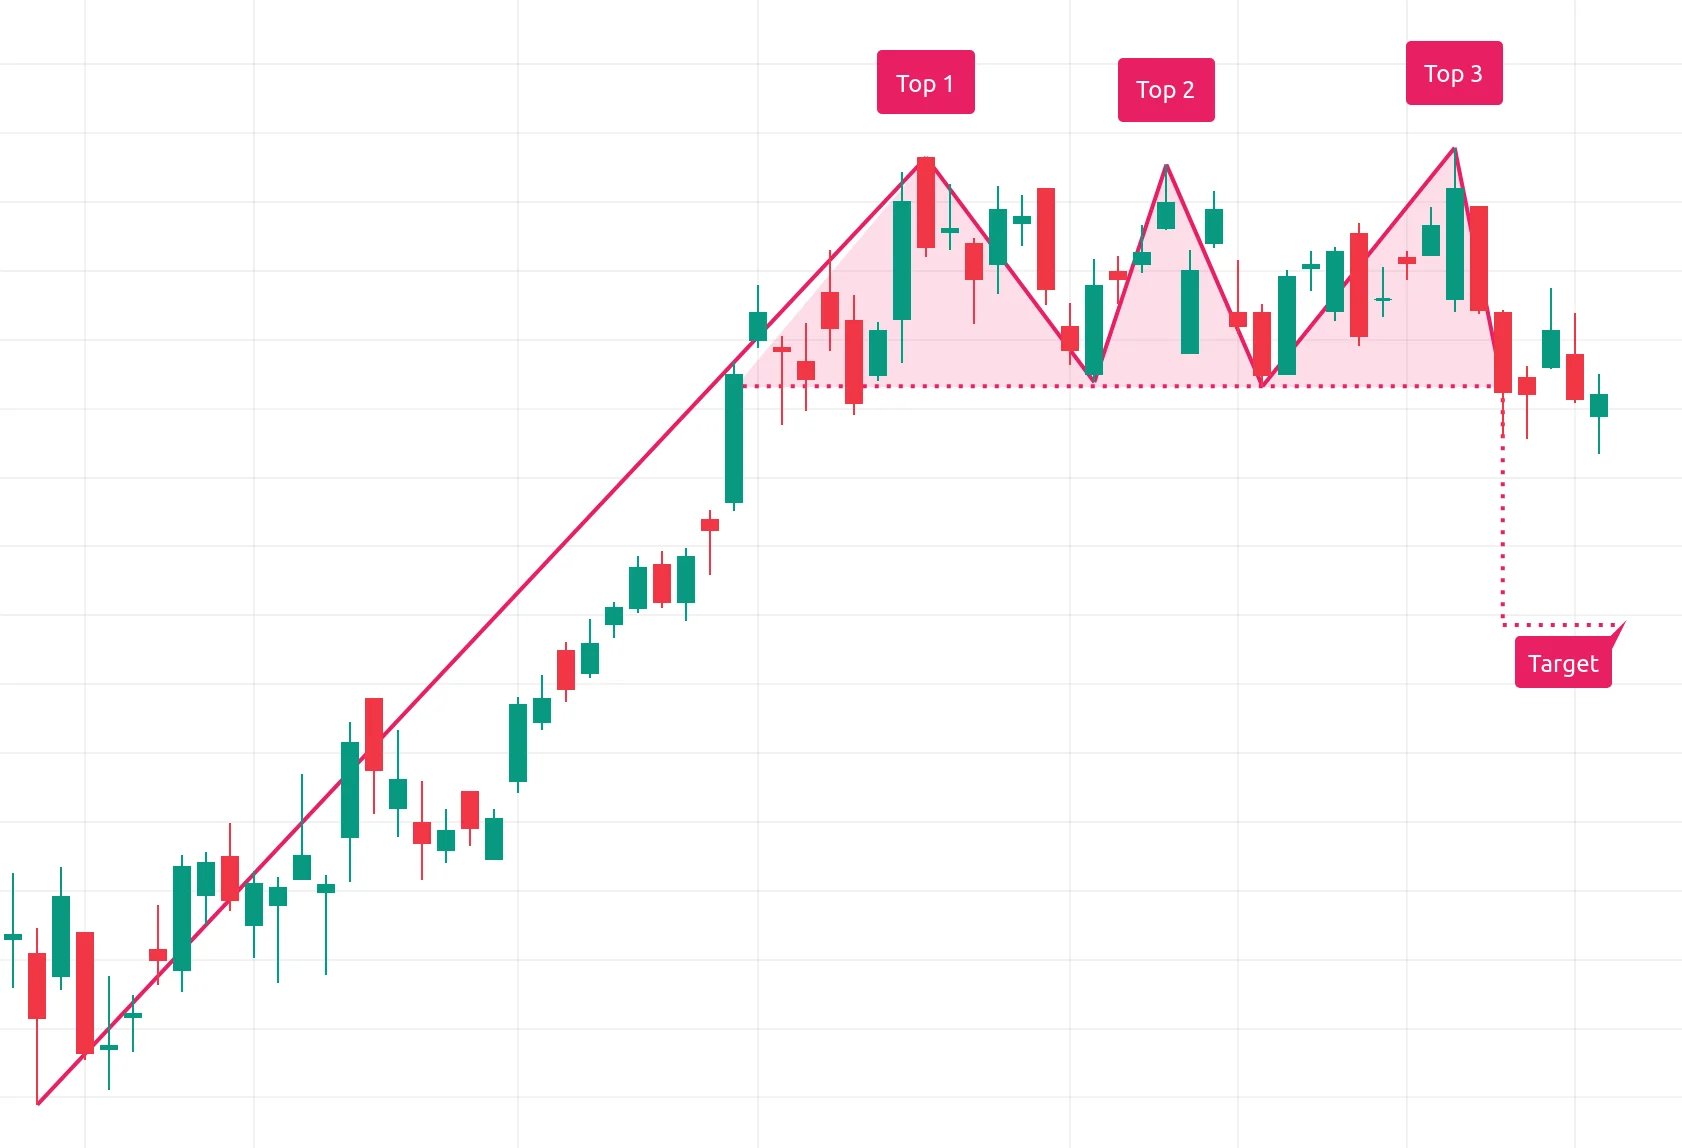
A Triple Top is a bearish reversal chart pattern used in technical analysis that is characterized by three distinct peaks at roughly the same price level. The Triple Top pattern forms in an uptrend and signals the potential weakening of the trend and the possibility of a trend reversal. The three consecutive peaks are separated by two troughs, with the middle trough being shallower than the other two. A confirmation of the pattern occurs when the price falls below the support level (formed by the troughs), indicating that the asset may move lower.
These patterns can be used to set target price levels. For a Triple Top, the target can be calculated by subtracting the distance between the support and the peaks from the breakout point. For a Triple Bottom, the target can be calculated by adding the distance between the resistance and the lows to the breakout point.
It's important to remember that while these patterns can be useful, they are not always perfect predictors of future price movement. Other forms of analysis should also be used to confirm signals.